www.TestsTestsTests.com
t-Test in Excel, F-test and z-Test Tutorial with 4 Videos
The Data Analysis ToolPak
Excel 2016 Tutorial
* How to Activate the Analysis ToolPak Add-In
* F-Test in Excel
* t-Test in Excel
* Using the T.TEST Formula in Excel
* z-Test in Excel
|
How to perform F-tests, t-Tests, and z-Tests using the Analysis ToolPak Excel 2016. |
 |
* How to Activate the Analysis ToolPak Add-In
Quick VIDEO introduction to Activating the Excel Analysis ToolPak
You can access these functions under the Data tab on the Ribbon.

Although bundled with Excel 2016, the Analysis ToolPak is not loaded by default after installation.

If you access the Data tab on the Ribbon but don’t see a section labeled ‘Analysis’, you’ll need to activate it yourself. In order to load the Analysis ToolPak add-in, do the following:
- Go to the File tab.
- From here, select Options (near the bottom left)
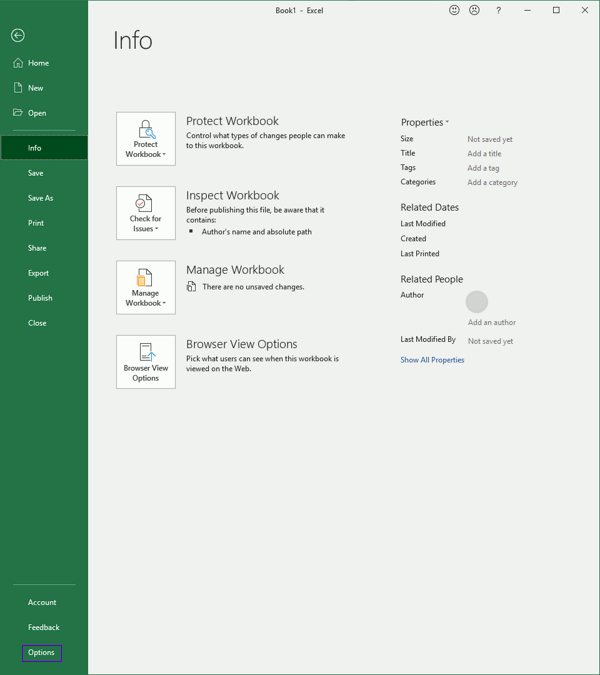
- Choose Add-ins from the left menu, make sure Excel Add-ins is selected, and click on the Go button.
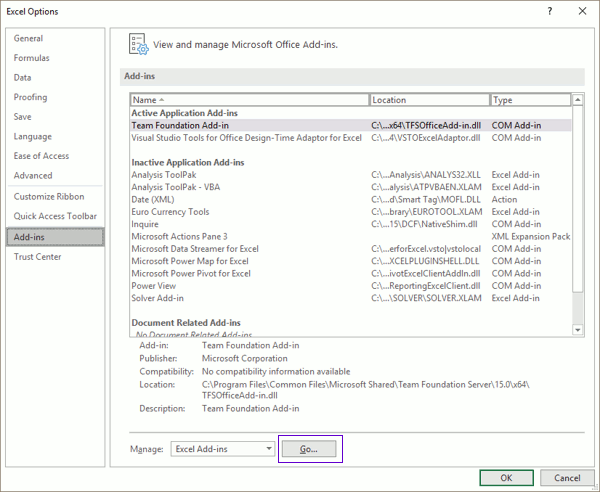
- Enable Analysis ToolPak and click on OK.
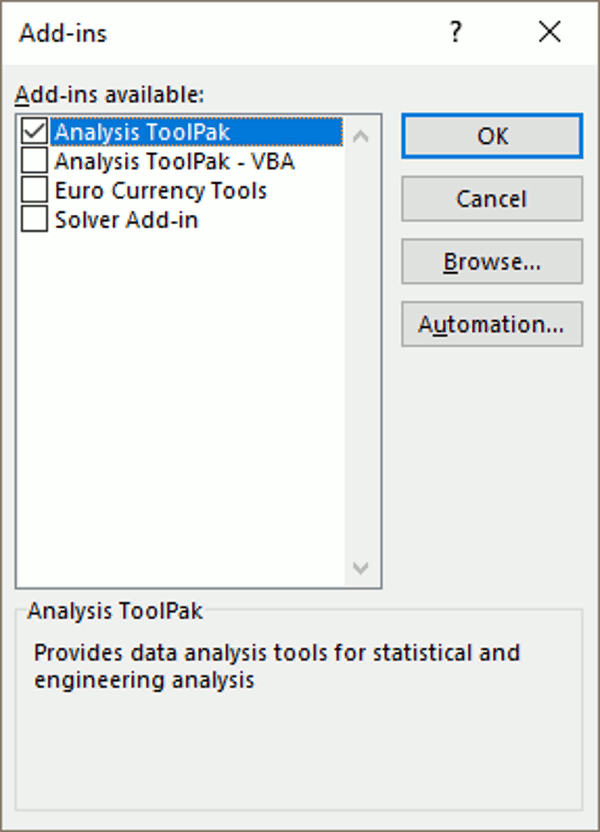
(The add-in for ‘Analysis ToolPak – VBA’ only needs to be activated when using this functionality in Macro programming, which is beyond the scope of this tutorial).
The Data Analysis button should now be accessible from the Analysis section of the Data tab.
* How to Do an F-Test in Excel Using the Wizard
Quick VIDEO introduction to the F-Test in Excel
In order to perform an F-Test, using the Data Analysis Wizard, go to the Data tab and click the ‘Data Analysis’ button (if the button is not visible, follow the instructions in the section above, titled “How to Activate the Analysis ToolPak Add-In”). You should now see the following dialogue:
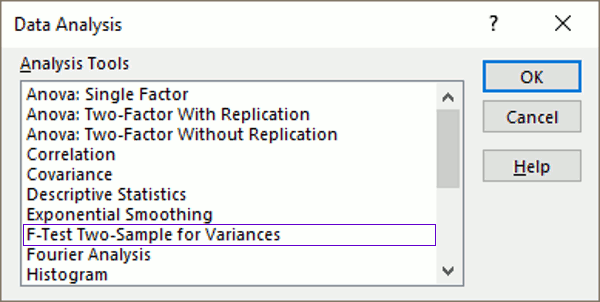
Select ‘F-Test Two-Sample for Variances’ and click ‘OK’, this presents you with the following dialogue:

Variable ranges (your samples) can be entered manually, or you can click the text box, then highlight the necessary cells using your mouse. If you select Output Range, under Output Options, note that the cell(s) specified will act as the top left corner of the output values, which span 3 columns and 10 rows. Click ‘OK’ to generate the F-Test output.
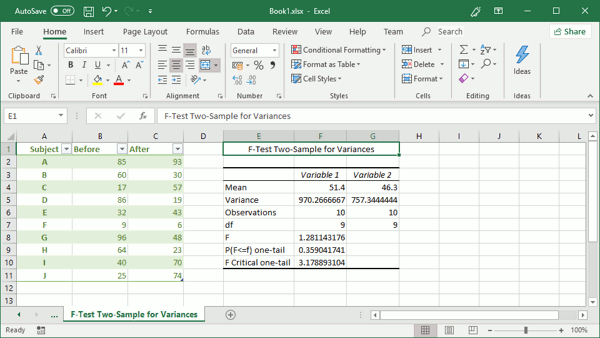
Note that the generated F-Test data is static and will not recalculate automatically if the samples are altered.
* How to Do a t-Test in Excel Using the Wizard
Quick VIDEO introduction to the t-Test in Excel
In order to perform a t-Test, using the Data Analysis Wizard, go to the Data tab and click the ‘Data Analysis’ button (if the button is not visible, follow the instructions in the section above, titled “How to Activate the Analysis ToolPak Add-In”). You should now see the following dialogue:
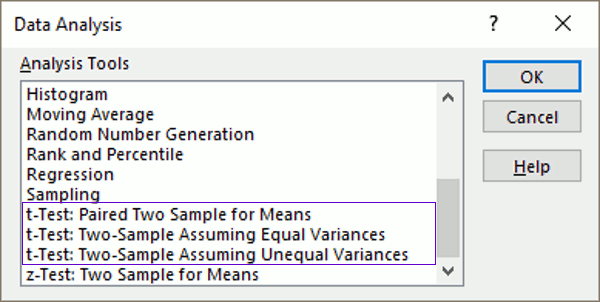
There are 3 types of t-Test to choose from
- t-Test: Paired Two Sample for Means
- t-Test: Two-Sample Assuming Equal Variances
- t-Test: Two-Sample Assuming Unequal Variances
Select one of the t-Tests and click ‘OK’, this presents you with the following dialogue:
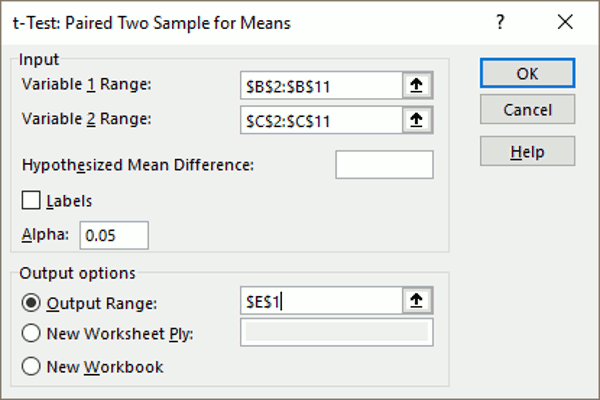
As with F-Tests, variable ranges can be entered manually, or you can click the text box, then highlight the necessary cells using your mouse. If you select Output Range, under Output Options, note that the cell(s) specified will act as the top left corner of the output values, which span 3 columns and up to 14 rows. Click ‘OK’ to generate the t-Test output.
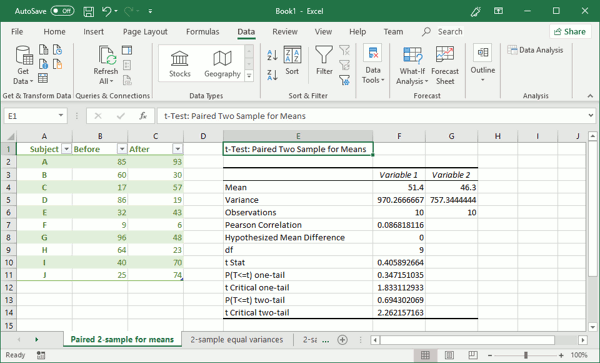
Note that the generated t-Test data is static and will not recalculate automatically if the samples are altered.
* Using the T.TEST Formula in Excel
Excel also includes a T.TEST function for calculating probability (P values), the use of which does not require the Analysis ToolPak to be activated. Syntax is as follows:
|
T.TEST (Array1, Array2, Tails, Type) |
|
|
Array1 |
The first set of samples. This is equivalent to Variable 1 range when using the wizard |
|
Array2 |
The second set of samples. This is equivalent to Variable 2 range when using the wizard |
|
Tails |
Enter 1 for one-tail, or 2 for two-tail |
|
Type |
A number between 1 and 3 depending on the type of t-Test to perform: |
Note, if Array1 and Array2 have a different number of data points, and you’ve specified a Type of 1 (Paired Two Sample for Means), the formula will return the #N/A error value.
By way of example, in order to calculate the P(T<=t) one-tail value from the example in the previous section, you could select the desired cell and type the following formula:
=T.TEST(B2:B11, C2:C11, 1, 1)
* How to Do a z-Test in Excel Using the Wizard
Quick VIDEO introduction to the z-Test in Excel
In order to perform an z-Test, using the Data Analysis Wizard, go to the Data tab and click the ‘Data Analysis’ button (if the button is not visible, follow the instructions in the section above, titled “How to Activate the Analysis ToolPak Add-In”). You should now see the following dialogue:
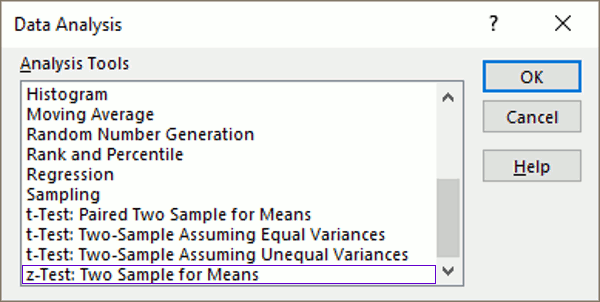
Select ‘z-Test Two-Sample for Means’ and click ‘OK’, this presents you with the following dialogue:
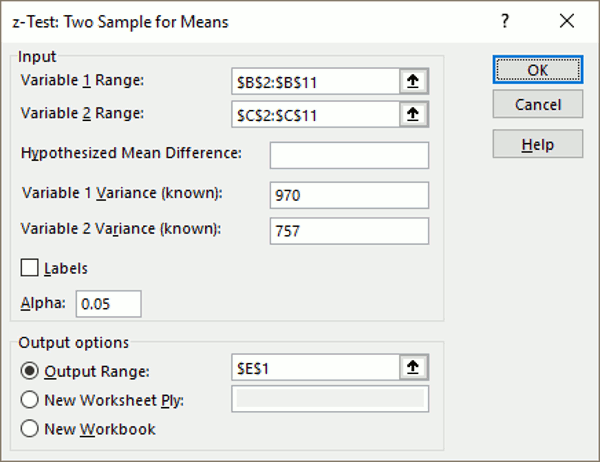
As with the other tests, variable ranges can be entered manually, or you can click the text box, then highlight the necessary cells using your mouse. Unless otherwise specified, the ‘Hypothesized Mean Difference’ will be assumed to be zero, however both variances are mandatory and may not be zero (you can get these values by running a t-Test).
If you select Output Range, under Output Options, note that the cell(s) specified will act as the top left corner of the output values, which span 3 columns and 12 rows. Click ‘OK’ to generate the z-Test output.
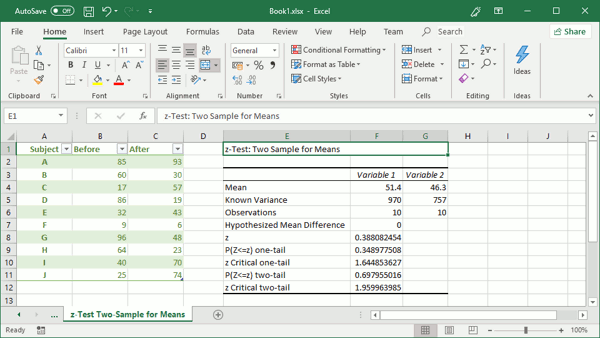
Note that the generated z-Test data is static and will not recalculate automatically if the samples are altered.
Woohoo! Now that you have done the tutorial:
TRY THE NEXT TUTORIAL: Coming soon!
TRY THE NEXT TEST: Coming soon!


